The Pulse data dashboard is powered by EventConnect’s™ industry-leading tournament solution software. The Pulse is a part of the Sports Tourism Research Institute, a product of Sports ETA. Data is drawn from the more than 4,000 sporting events in our platform then segmented into eight data visualization, creating a snapshot of key sports events and tourism industry metrics.
Example of the Pulse dashboard.
The purpose of this data is to provide a “Pulse” on key industry metrics to help you align with sports events and tourism trends. If you are interested in using EventConnect’s™ all-in-one tournament and sport software solution and having your event’s data represented in The Pulse, schedule a demo here.
Booking Bonanza
Hotel reservations (per team) and average length of stay were some of the strongest metrics identified during the sports events and tourism industry’s comeback in 2021. The trend has continued throughout 2022 as the monthly average of 10.8 reservations is 17.4% higher than the same 5-month span in 2021. This year has started with five consecutive months of an average length of stay above 3.0. To put this in perspective, the industry only saw two months reach 3.0 during 2020 and 2021 combined!
Insight: Hotel usage has climbed significantly as more tournaments and other sporting events open up across the nation. May 2022 (3.39) represents a full one day increase over May 2020 (2.31). This extra day of business has, and will continue to, provide a massive boost to local economies across the nation.
Temperature Check
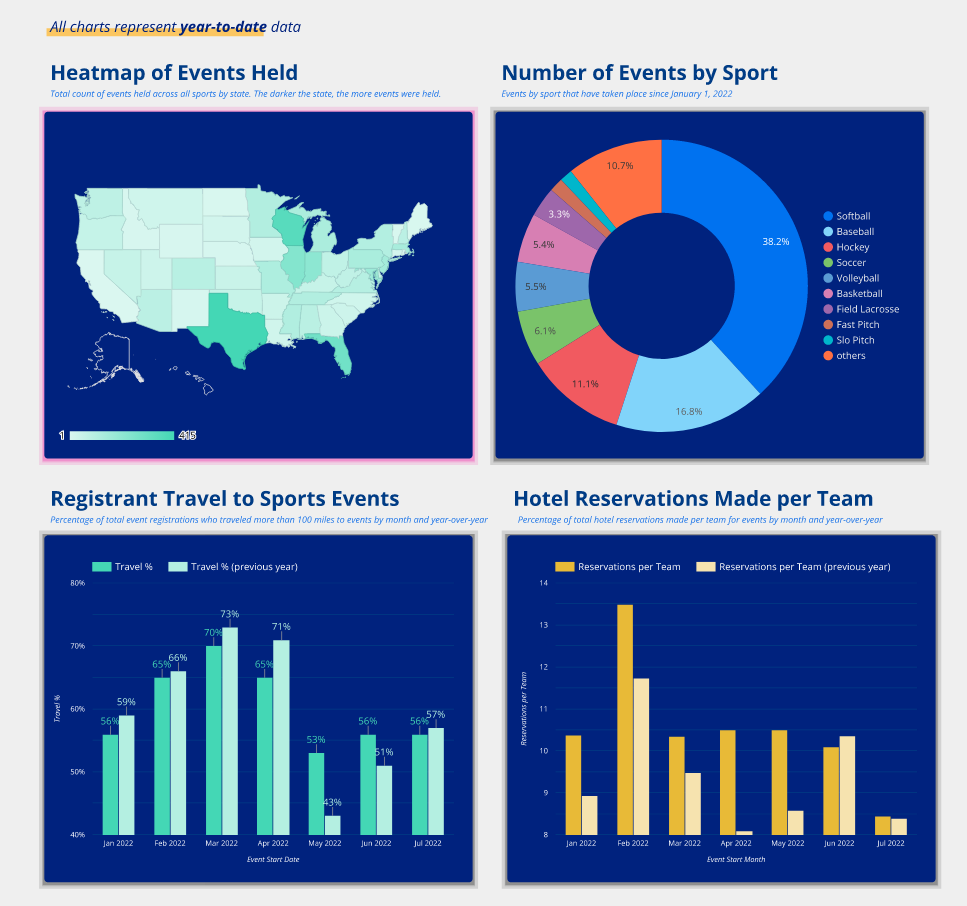
A quick look at the EventConnect™ heat map (populated by those events utilizing the software) indicates the overall number of hosted events (year-to-date data) has risen 7.1% since the last edition of the Pulse. States in the South and Midwest regions of the United States continue to lead the way with a combined 68.2% share.
Insight: Since May 2021, states have hosted over 4,200 events for an average of 85.9 per state. 37 states (75.5%) enjoyed an increase over the last three months and those with the largest gains include: Arizona (up 69.6%), West Virginia (up 34.7%), Missouri (up 19.8%) and California (up 14.1%). COVID appears to be in the rearview mirror as more and more states continue to enjoy the benefits of unrestricted opportunities to host events and boost tourism.
Breaking Free?
For the first quarter of 2022, registrant travel numbers had risen steadily (yearly high of 70% in March), but the overall percentages were very similar to those seen in 2021. While slightly lower, May saw 57% of registrants traveling over 100 miles (up from 40% in May 2021), which is a very encouraging development (increase of 42.5%). Insight: Even though the pandemic taught us not to take anything for granted, EventConnect™ data suggests the industry is poised for a travel breakout in the summer of 2022. In 2021, the monthly average for June-August was 48.6%. This number should be shattered in 2022 as more families pack for extended vacations that take them outside of their respective home states.
ADR is Reaching New Heights
Due to pandemic-related e ffects, the average daily rate over the past two years has been disappointing to say the least. However, the 2022 ADR trend is outstanding (5-month average of $155.52) and should continue to rise over the summer months. The March ADR was $167.05, which was the highest rate since April 2020. When looking year-to-year, May 2022 ($154.44) was up 21% over last year ($127.73).
Insight: Buoyed by increased hotel reservations and average length of stay, one would assume that ADR would continue to climb in the next quarter. However, factors such as inflation and gas prices are definite concerns. Industry data tells us that more Americans want to travel as the pandemic subsides, but questions about a ffordability have entered the equation. A notoriously unpredictable metric over the past two years, ADR could experience some fluctuation over the next quarter but we are betting on a strong summer as families make up for trips and experiences cancelled due to the pandemic.
Timing is Everything
Hotel reservation and event registration lead times continue to trend in the right direction although they have yet to reach pre-pandemic levels. After a strong start in the first quarter (77.9 days), hotel registration has declined in recent months (average of 50 days in April-May). However, the 2022 January-May average of 67.2 is up 2.0% over the same time period last year. Event registration has fared better as its 5-month average of 78.8 in 2022 is 14.4% higher than a year ago. The 96.9 day peak in February was the highest the industry had seen since July of 2020.
Insight: Even though lead times continue to be frustratingly inconsistent, the good news is that these metrics continue to improve over time. Look beyond the one-month dips and focus instead on the long-term picture. Events are returning, hosts are putting dates on the calendar, and travellers will seek advance registration for a variety of beneficial reasons. Over the past two years, the most positive months for lead times were in late summer and early fall, so look for this trend to continue.
Actionable Takeaways
- Prepare for a perfect storm. Now that the vast majority of the nation is open for business, the sports events and tourism industry is on the verge of having an extremely strong third quarter. The cost of travel is obviously concerning, but Americans are ready to spread their wings and get back to their normal summertime activities and travel habits. The old saying “If you build it, they will come” is now “they are coming, is your building (destination/organization) ready?”
- Perform your own “Pulse Check.” National data is obviously helpful, but how does your organization stack up against the numbers? What are you and your team currently doing to recruit more business, increase visitor hotel stays, or boost overall lead times? Dig deeper into industry trends and collaborate with local and/or statewide peers to identify areas where improvements could be made. We live in a world filled with information, but how we use it to our advantage is what separates us from the competition.
- Fill your box(es). In the February Pulse, we urged organizations to “remain outside the box” and explore ways to diversify their event portfolios. Now that this research has been conducted and you know where your strengths lie, start filling your calendar with higher-quality tourism business and embrace a CQI (Continuous Quality Improvement) mentality. The pandemic brought some short-term setbacks, but it also caused the industry to reflect on ways to improve visitor experience and enhance local quality of life.